Zabbix vs Prometheus: Which Monitoring System to Choose for Infrastructure in 2026?
Greetings, friends!
When building and scaling corporate IT infrastructure, selecting a monitoring system becomes a fundamental architectural decision. Making a mistake at this stage can result in lost metrics during outages, inflated infrastructure costs for monitoring overhead, and constant alert fatigue for engineering teams.
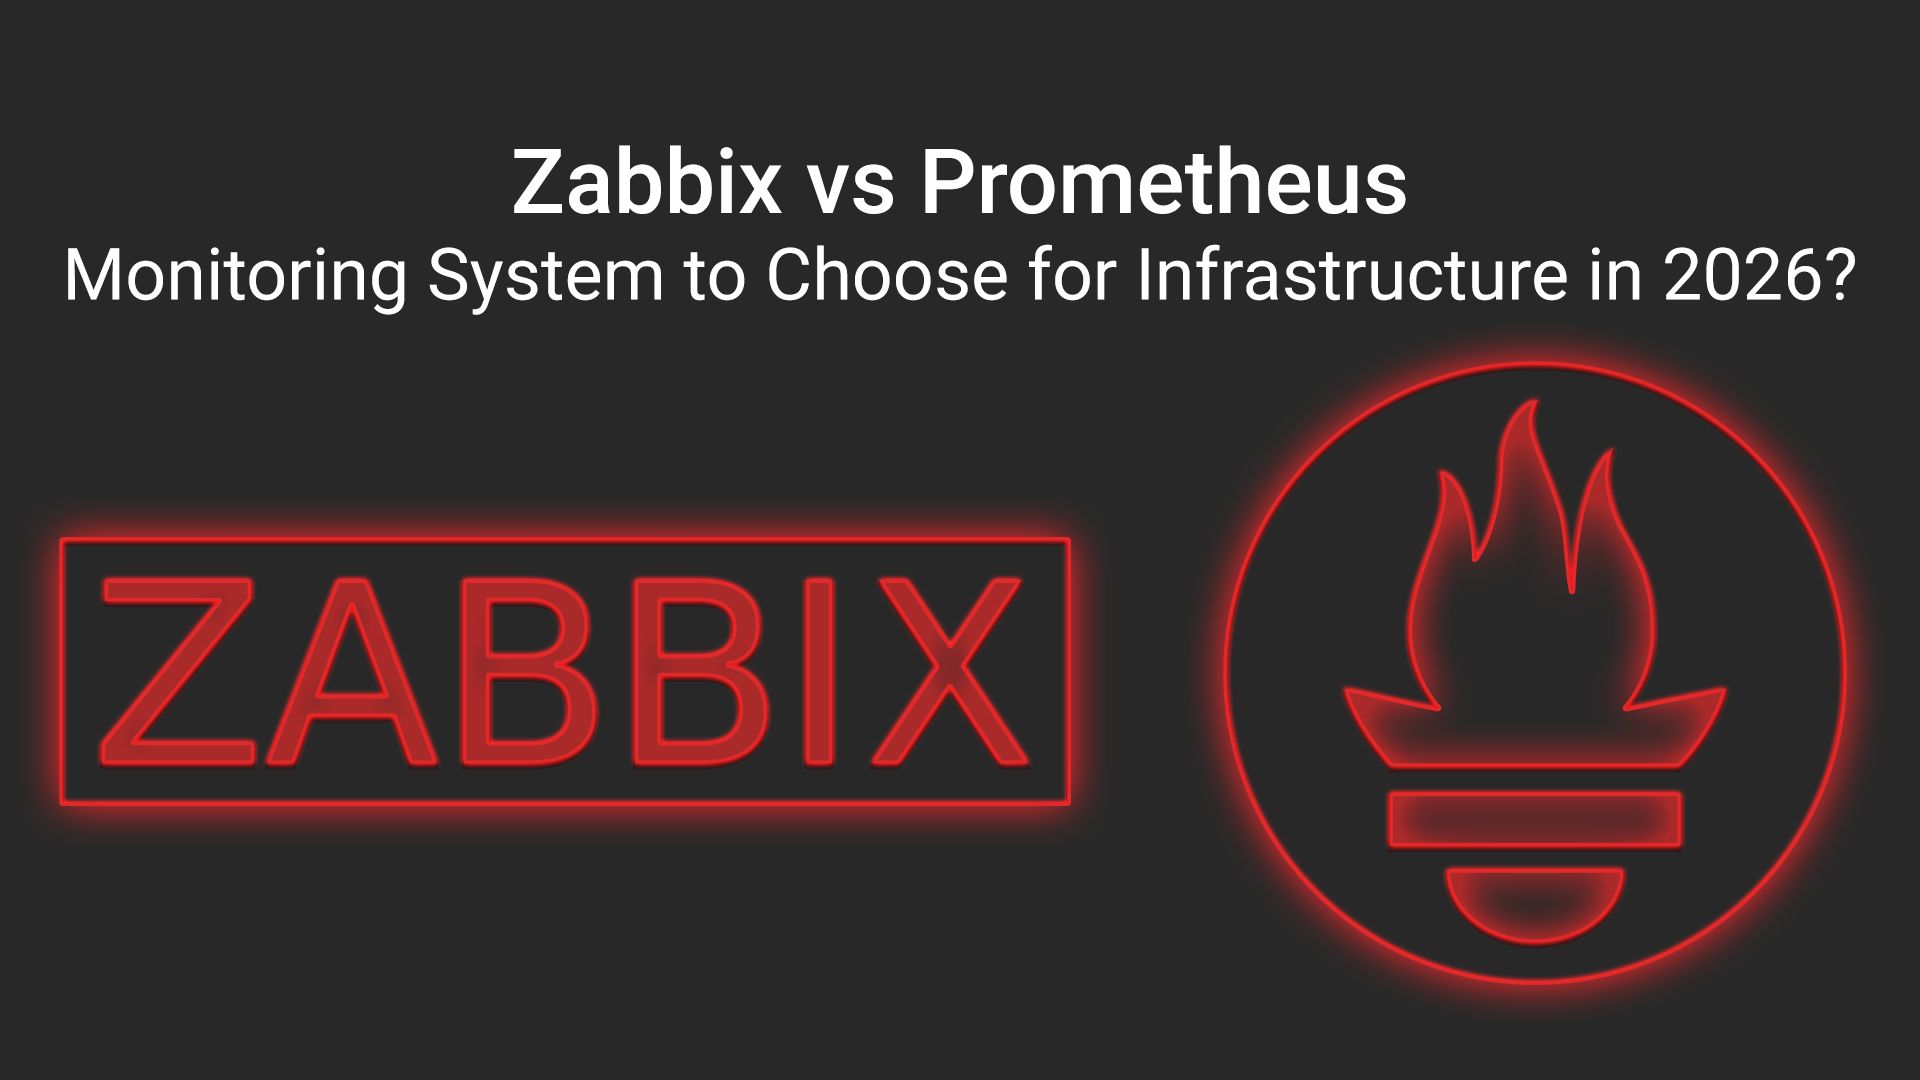
The two main industry giants—Zabbix and Prometheus—offer fundamentally different philosophies for data collection and analysis. In this article, we will break down the technical differences between both solutions to help you choose the optimal tool for your environment.
Key Takeaways: Core Conclusions
Prometheus is the standard for dynamic, containerized environments: Thanks to its Pull model, native integration with Service Discovery, and the powerful PromQL query language, Prometheus is ideal for Kubernetes, microservices, and rapidly changing Cloud-Native ecosystems.
Zabbix is the leader for classic hybrid infrastructure: If your tech stack includes bare-metal servers, network equipment (SNMP), virtualization platforms (VMware, Proxmox), and legacy OS installations, Zabbix delivers a robust out-of-the-box solution complete with an integrated web UI and role-based access control.
Hybrid Monitoring (Zabbix + Prometheus) is a common Enterprise choice: In large enterprise setups, these systems often complement each other. Prometheus handles application metrics and Kubernetes clusters, while Zabbix manages network channels, hardware health, and database infrastructure.
Video Installation Guide for Zabbix
We recorded a video demonstrating the entire installation process. You can watch it right here:
Architectural Differences: Pull vs Push and Data Structures
The primary difference between Zabbix and Prometheus lies in their data collection models and internal storage mechanisms.
1. Prometheus: Time-Series DB and Pull Model
Prometheus is optimized for time-series data. It periodically scrapes (Pull) target endpoints via HTTP (/metrics), where applications and exporters expose metrics in a standardized text format.
Data Model: A metric consists of a metric name and key-value labels, e.g.,
http_requests_total{status="200", method="POST"}.PromQL Query Language: An exceptionally powerful query language designed for real-time mathematical analysis, aggregation, and trend calculations.
Service Discovery: Automatically detects new containers in Kubernetes, cloud instances (AWS), or virtual servers.
2. Zabbix: Classic Architecture with Centralized RDBMS
Zabbix relies on traditional relational or time-series databases (PostgreSQL with TimescaleDB, MySQL) and supports both Push (Zabbix Agent Active) and Pull (Zabbix Agent Passive, SNMP, IPMI) data collection methods.
Data Model: Built around specific "Items" bound to explicitly defined network entities ("Hosts").
Built-in Capabilities: Includes an advanced web dashboard system, network mapping, Role-Based Access Control (RBAC), and customizable trigger logic out of the box, eliminating the need for mandatory third-party visualization tools.
Comparison Matrix: Zabbix vs Prometheus
| Evaluation Criterion | Prometheus | Zabbix |
| Primary Focus | Microservices, Kubernetes, Cloud-Native, application metrics | Network devices (SNMP), bare-metal servers, virtualization, Enterprise |
| Collection Architecture | Pull (HTTP scraping of exporters) | Hybrid (Push / Pull, Zabbix Agent, SNMP, IPMI) |
| Data Storage | Custom TSDB (requires Thanos/Cortex for long-term storage) | Relational DBs (PostgreSQL + TimescaleDB, MySQL) |
| Analytics Language | PromQL (highly flexible) | Built-in trigger expression functions |
| Visualization | Requires Grafana (native UI is minimal) | Built-in customizable dashboards and network maps |
| Network Monitoring (SNMP) | Complex (requires snmp_exporter) | Native out-of-the-box (prebuilt templates for Cisco, MikroTik, etc.) |
Which System Should You Choose for Your Infrastructure?
Choose Prometheus if:
Your infrastructure is built around Kubernetes, Docker, or microservice architectures.
You need to track custom application business logic metrics (using client libraries for Go, Python, Java, etc.).
Your environment is highly dynamic, with servers and containers scaling up and down automatically (Autoscaling).
You already use Grafana for dashboards and require flexible mathematical query analytics (PromQL).
Choose Zabbix if:
You manage a distributed network infrastructure with hundreds of switches, routers, UPS units, and physical bare-metal nodes.
You want a turnkey, all-in-one solution featuring logging, network topology maps, and granular user permissions for different departments.
Your infrastructure is mostly static (classic KVM VPS, dedicated servers, VMware/Proxmox hypervisors).
You require long-term metric history retention without deploying complex distributed storage extensions.
FAQ: Frequently Asked Questions
Can Zabbix and Prometheus be used together?
Yes, this is a widespread enterprise pattern. Prometheus metrics can be exported into Zabbix, or both systems can serve as independent data sources within a single Grafana dashboard interface.
Which system consumes more server resources for monitoring?
Prometheus uses disk space and CPU very efficiently thanks to its custom TSDB format, making it capable of handling millions of metrics, though it can be memory-intensive (RAM). High-load Zabbix setups typically hit database I/O bottlenecks (PostgreSQL/MySQL), making fast NVMe disk performance critical for large Zabbix installations.
Do both systems support distributed multi-site setups?
Yes. Zabbix uses Zabbix Proxies to collect data from remote sites and isolated subnets, buffering metrics during network interruptions. Prometheus uses agents (Promtail/Agent) or federated architectures (Federation / Thanos) for distributed monitoring.
Conclusion
Choosing between Zabbix and Prometheus is not about finding the absolute "best" tool, but matching the right tool to your architectural stack. Prometheus excels in dynamic Cloud-Native environments and microservices, while Zabbix remains the undisputed king of hardware, network, and traditional virtualization monitoring.
Regardless of your choice, monitoring stability depends on the reliability of the platform hosting it. A monitoring server outage during an incident leaves your engineering team completely blind.
If you are looking for a resilient platform to host your Zabbix Server or a Prometheus cluster with Grafana, explore NVMe Cloud VPS options from MivoCloud.
Article Author: Anatolie Cohaniuc